[three]Bean
Fedmsg Health Dashboard
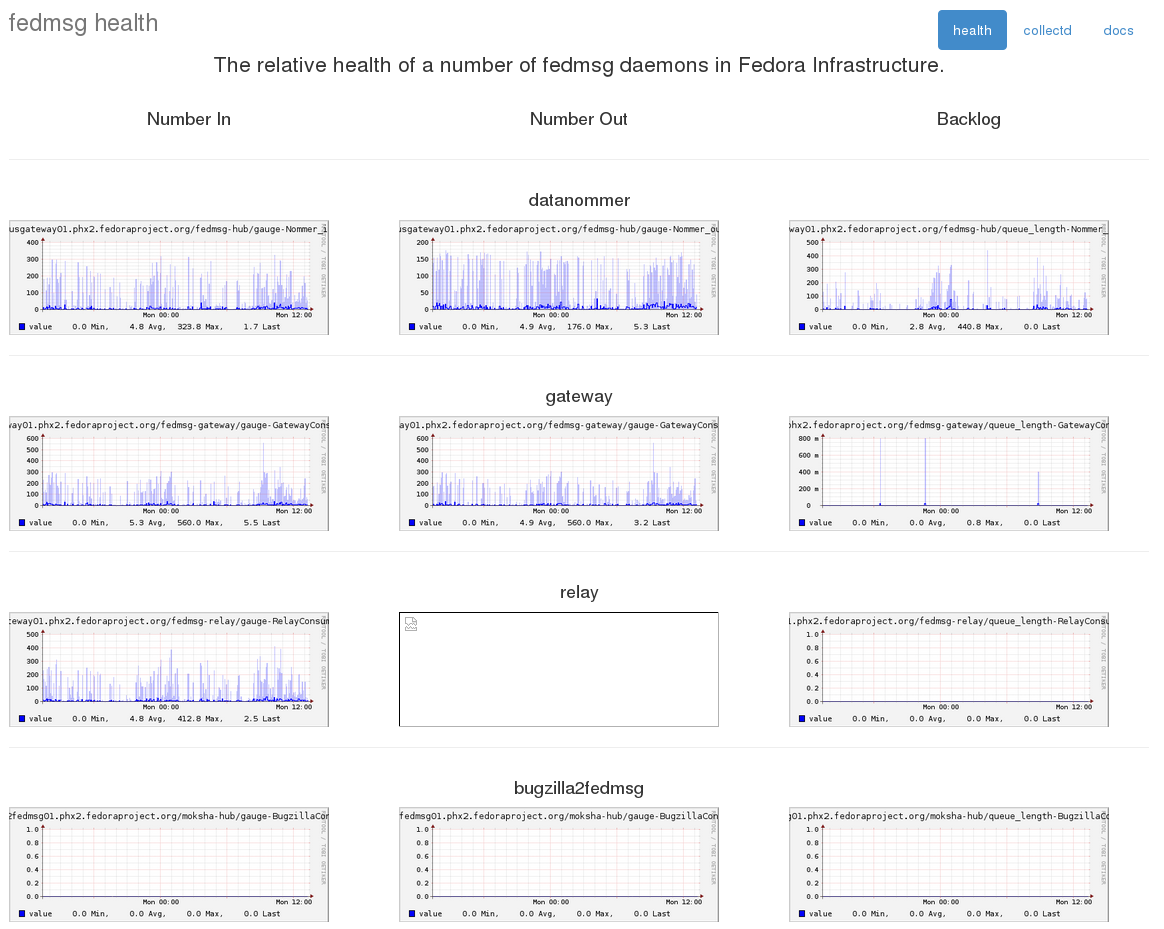
Sep 29, 2014 | categories: fedmsg, fedora, collectd View CommentsWe've had collectd stats on fedmsg for some time now but it keeps getting better. You can see the new pieces starting to come together on this little fedmsg-health dashboard I put together.
The graphs on the right side -- the backlog -- we have had for a few months now. The graphs on the left and center indicate respectively how many messages were received by and how many messages were processed by a given daemon. The backlog graph on the right shows a sort of 'difference' between those two -- "how many messages are left in my local queue that need to be processed".
Having all these will help to diagnose the situation when our daemons start to become noticably clogged and delayed. "Did we just experience a surge of messages (i.e. a mass rebuild)? Or is our rate of handling messages slowing down for some reason (i.e., slow database)?"
This is mostly for internal infrastructure team use -- but I thought it would be neat to share.
 [three]Bean.org